Debugging Node.js Azure Web Apps (Websites)
Deploying Node websites to Azure is really simple with their Git deployment feature. However, sometimes debugging problems can be challenging. Here are some of the tricks I’ve discovered for diagnosing problems with Node apps in Azure.
Viewing Application Output
To view application logs (a.k.a. stdout and stderr) from your app, you can turn on Application Logging from the management portal’s “Configure” tab.
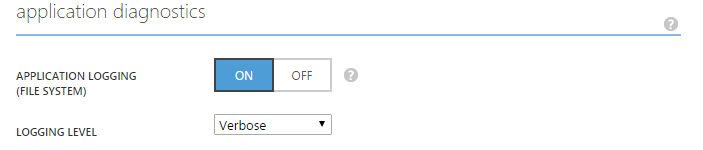
Note that application logging will only be turned on for 12 hours, so if you need to be able to see historical logs, you need to save them to a file from within your application.
To view the logs, you can go to the Kudu dashboard at “<yourazuresite>.scm.azurewebsites.net”.
Select either CMD or PowerShell from the “Debug console” menu, then navigate to LogFiles/Application.
Scroll until you find index.html and click the download button (which will display it in your browser).
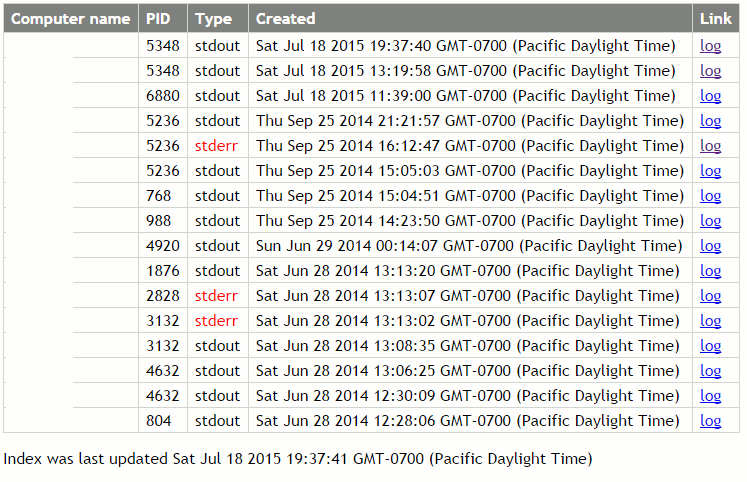
From there you can scan through for the logs from the time period you’re interested in and click the “log” link. Notice that the logs are split by “stdout” and “stderr”.
Other IIS Logs
To enable other IIS related logs, go to the “site diagnostics” section. These settings can be useful for debugging IIS level issues.
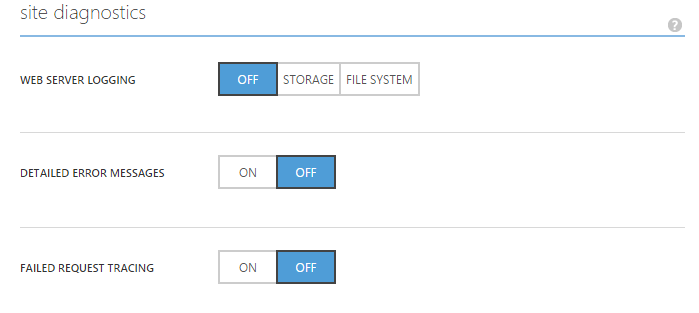
You can find these logs in a few different folders under “LogFiles” in the Kudu dashboard.
Using Node Debugger
Node Inspector is a really useful tool for digging into problems with your Node app.
I’ll often spin it up locally if I’m investigating an issue that isn’t easily revealed with a console.log statement.
However, sometimes bugs only reproduce on the server. If that happens, using the version of Node Inspector built into Azure can be really useful.
Enabling Websockets
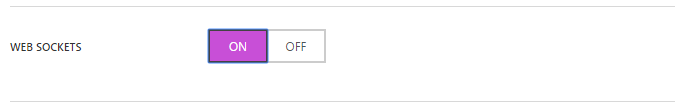
Node inspector uses WebSockets to communicate between the UI and the debugger backend. Since Azure Websites doesn’t enable them by default, you’ll need to manually enable WebSockets in the “Configure” tab of the management portal.
Check Your Web.config
If you deployed your site with a Git push, Kudu should have generated a Web.config with correct configuration for debugging. If not, I have a generalized Gist that I use as a starting point. Just change the references to bin/www to reflect the correct entrypoint for your app.
Enable Debugging
To enable debugging, you can either modify your Web.config or create/modify an iisnode.yml file.
In the Web.config, it looks like this:
1 2 3 4 | |
Or in iisnode.yml, it looks like this:
1
| |
The advantage of using iisnode.yml is that you don’t have to worry about a new deployment generating over your existing configuration. It’s also worth noting that you can configure a bunch of other settings in both the iisnode.yml and the Web.config.
Testing Out the Debugger
To use the debugger, go to your azure website, and append the entry point path, and /debug. So for example, if your entry file was server.js, you’d go to <yourazuresite>.azurewebsites.net/server.js/debug
If everything’s configured correctly, you should see the debugger. You can set breakpoints and debug the route handlers for your app.
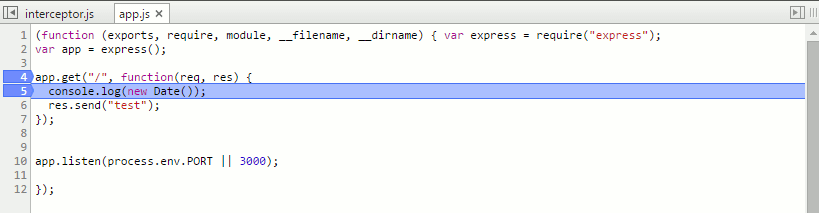
Keep in mind that when you set a breakpoint, the entire app is halted. This means you probably don’t want to attach the debugger to an app that’s serving production traffic.