Simple Trick for Juggling Related Git Branches

At my job, it’s not uncommon to work on a change that builds on another change which is still in code review. Sometimes a coworker is adding a component that I want to consume, and other times I’m just breaking my own work into multiple stages to simplify code review.

We squash commit to master rather than merging development branches, so whenever the code I depend on lands in master, I do an interactive rebase. This removes the unsquashed commits and cleans up my development branch. I also do a similar rebase if the code I’m building on is updated while it’s still in development.

In either case, it can sometimes be tedious to figure out which commits in my branch are mine, and which commits I’m building on. This is especially annoying if I’m building on my own branch, because then all the commit authors looks the same. To solve this, I’ve started leaving a marker for myself in the form of an empy commit to delineate my changes.

1
git commit --allow-empty -m "============="

This way when I rebase, I get a nice little marker in the interactive rebase screen that tells me where to start throwing away commits.

Because the commit is empty, the rebase command will automatically ignore it by commenting out the commit. If I’m done with the marker, I’ll remove it or just leave it commented out. Otherwise, I uncomment that line to keep the marker commit around after the rebase. Either way, since we squash commit to master, the empty commit eventually disappears and doesn’t clutter up my Git history.

This is also fairly trivial to even if you have an in-progress branch that you later decide to rebase onto another in-progress branch. Here’s how I do it:

That’s pretty much it. I’ve found this to be a helpful way to leave myself breadcrumbs, especially when I haven’t touched a branch for some time.

Git

Adding Timestamps to Arbitrary Logs

I was recently looking at a log file generated by a cron job and was frustrated to discover that the log didn’t have timestamps. After a little thought, I figured out how to make sure all future logs from that cron job have timestamps.

In my case, the cron job was a Let’s Encrypt renewal:

/opt/letsencrypt/letsencrypt-auto renew >> /var/log/le-renew.log

Since I’m not in control of the output of letsencrypt-auto renew, I need to insert the timestamps. Using a Bash while loop solves this easily:

/opt/letsencrypt/letsencrypt-auto renew | while read -r l; do echo "$(date) $l"; done >> /var/log/le-renew.log

The while -r l reads the output line-by-line into the variable $l, then prints it out, prefixing with the date command. Then it pipes everything into the same log.

You’ll get output like this:

1
2
3
4
5
6
7
8
9
10
11
12
13
Tue Oct  3 19:01:03 EDT 2017 
Tue Oct  3 19:01:03 EDT 2017 -------------------------------------------------------------------------------
Tue Oct  3 19:01:03 EDT 2017 Processing /etc/letsencrypt/renewal/mimic.io.conf
Tue Oct  3 19:01:03 EDT 2017 -------------------------------------------------------------------------------
Tue Oct  3 19:01:03 EDT 2017 
Tue Oct  3 19:01:03 EDT 2017 -------------------------------------------------------------------------------
Tue Oct  3 19:01:03 EDT 2017 
Tue Oct  3 19:01:03 EDT 2017 The following certs are not due for renewal yet:
Tue Oct  3 19:01:03 EDT 2017 /etc/letsencrypt/live/mimic.io/fullchain.pem (skipped)
Tue Oct  3 19:01:03 EDT 2017 No renewals were attempted.
Tue Oct  3 19:01:03 EDT 2017 -------------------------------------------------------------------------------
Wed Oct  4 19:01:01 EDT 2017 Upgrading certbot-auto 0.18.2 to 0.19.0...
Wed Oct  4 19:01:01 EDT 2017 Replacing certbot-auto...

If you wanted to customize the date format, you could do it like this:

1
$(date "+%Y-%m-%d %H:%M:%S")

In the cron definition it would look like this:

/opt/letsencrypt/letsencrypt-auto renew | while read -r l; do echo "$(date "+%Y-%m-%d %H:%M:%S") $l"; done >> /var/log/le-renew.log

If your cron command gets complicated enough, it might be worth moving it to a shell script that you invoke from the cron job.

1
2
3
4
5
#!/bin/bash

/opt/letsencrypt/letsencrypt-auto renew | while read -r line; do
  echo "$(date "+%Y-%m-%d %H:%M:%S") $line"
done >> /var/log/le-renew.log

That’s basically it…

You could easily prefix your logs with other things as well, but I’ll leave that as an exercise for the reader.

Consuming and Searching CSV Logs With JSON Tools

If you ever find yourself working with logs or traces stored as CSV files, it’s fairly trivial to convert them to JSON to simplify searching and manipulating them. This blog post describes some tools that can help you filter and format the logs into something more useful.

The two tools we’ll be using are csv2json and json. These are Node modules, so you’ll need to install Node first, then run the following command to install the two packages globally.

1
npm install -g csv2json json

These tools should now be on your path. To confirm, try running csv2json --help

You can use the csv2json to convert the CSV log files into JSON files. The JSON format places the column headers next to the column values, which is less space efficient, but makes it much easier to read the file.

1
csv2json trace.csv trace.json

The JSON traces will then look something like this:

1
2
3
4
5
6
7
[
{"PreciseTimeStamp":"3/24/2017 12:25:17 PM","ComponentGuid":"bd3facb0-1775-590d-e3ab-59f56bb23206","EventName":"DownloadStarted","AppId":"cd56de80-67c6-414a-a0af-f6b22a47b6d7"},
{"PreciseTimeStamp":"3/24/2017 12:35:17 PM","ComponentGuid":"bd3facb0-1775-590d-e3ab-59f56bb23206","EventName":"DownloadCompleted","AppId":"cd56de80-67c6-414a-a0af-f6b22a47b6d7"}
...
...
...
]

Now at least the column names/values are closer together, so it’s easier to see what column type you’re dealing with. However, it’s still not easy to visually parse the data. That’s where the json tool comes in. In its most basic form, it pretty-prints json, making it easier to visually parse:

1
2
3
4
5
6
7
8
9
10
11
12
13
14
15
cat trace.json | json
[
  {
    "PreciseTimeStamp": "3/24/2017 12:25:17 PM",
    "ComponentGuid": "bd3facb0-1775-590d-e3ab-59f56bb23206",
    "EventName": "DownloadStarted",
    "AppId": "cd56de80-67c6-414a-a0af-f6b22a47b6d7"
  },
  {
    "PreciseTimeStamp": "3/24/2017 12:35:17 PM",
    "ComponentGuid": "bd3facb0-175-590d-e3ab-59f56bb23206",
    "EventName": "DownloadCompleted",
    "AppId": "cd56de80-67c6-414a-a0af-f6b22a47b6d7"
  }
]

Now you can more easily scan down the columns, but it takes up a ton of space, and you probably don’t care about most of the columns. If you only want a few columns, you can use the json -a <ColumnName1> <ColumnName2> command to output specific columns in plaintext.

1
2
3
type trace.json | json -a PreciseTimeStamp EventName
3/24/2017 12:25:17 PM DownloadStarted
3/24/2017 12:35:17 PM DownloadCompleted

If you don’t want the intermediate JSON file, you can also pipe the output of csv2json directly to the json command. However, if you plan to run multiple calls to json, you will save execution time by only calling csv2json once.

1
csv2json trace.csv | json -a PreciseTimeStamp EventName

Also, if you already have a json file, you can provide its path to the json tool directly rather than using the cat command. This is really just a matter of preference:

1
2
3
4
5
json -f trace.json -a PreciseTimeStamp EventName

# same as

cat trace.json | json -a PreciseTimeStamp EventName

If you want to filter the logs, you can use the -c flag. The syntax is JavaScript, and the this variable contains the JSON object for the specific row being filtered.

For example, to filter to a specific EventName, you could use something like this:

1
2
cat trace.json | json -a PreciseTimeStamp EventName -c 'this.EventName == "DownloadCompleted"'
3/24/2017 12:35:17 PM DownloadCompleted

There’s lots more that the json tool can do. Check out the http://trentm.com/json/.

Writing Useful Tests: Naming Tests and Writing Assertions

Last time I blogged about organizing your tests so that they’re easier to maintain. Today I want to look at why you should put thought into naming your tests and writing assertions.


When you first write your tests, you (hopefully) have all the context of the code you’re testing. You know how the code should work, and you know what your test is trying to validate. However, if the test starts failing 6 months down the road, you probably won’t have all that context. Writing verbose test names and assertion messages will make it much easier for you to regain that context.

Naming Things

It’s Monday, and you just poured your first cup of “Damn Fine Coffee”.

You’re checking the morning influx of email and open an email about failing tests. You’re greeted with this helpful summary:

1
2
3
4
Failing Tests:
  - User Creation

  Expected "false" to be "true"

Well, that’s helpful…

Obviously this is a contrived example, but it illustrates two potential problems with your tests.

Problem 1: Generic Names

In the example above, the test is called “User Creation”, which isn’t very descriptive. Now you have to find the code for the test and re-grok it, just to remember what the test does. Only then can you figure out why it’s failing.

It might be better to call this test something like “User creation succeeds with valid email and matching passwords” or “User creation fails with an invalid email”. If the test does more than what those detailed titles describe, it’s probably time to break it into smaller tests.

Problem 2: Generic Assertions

The other thing you’ll notice from the example is the reason the test failed: Expected "false" to be "true".

That doesn’t really help you track down the problem. You know there’s probably a failing assertion, but if you have many “assert” statements in your test, it may not be immediately clear whith one failed. Adding a clear assertion message can make it much simpler to track down the part of the test that’s failing.

1
2
3
4
5
6
7
8
9
// Before
var succeeded = false;
assert(succeeded);
// Expected "false" to be "true"

// After
var succeeded = false;
assert(succeeded, "User creation should have succeeded");
// Expected "false" to be "true". User creation should have succeeded

Now it’s easy to find the assertion in your code that’s failing. Plus, your “tests are failing” email will tell you why the test is failing before you’ve even fired up your editor.

That Was Easy

Ok. You’ve fixed your tests. Time to treat yourself to more coffee, and maybe some donuts.

Yes, I did just finish watching Twin Peaks. Why do you ask?

Writing Useful Tests: Organization

Most people agree that writing tests is an important part of software development. However, not all tests are created equal.

Working on a number of projects over the years, I’ve run into a few pitfalls and gotchas that I want to cover in the next few blog posts. This won’t be a comprehensive guide to testing. Others have already done a better job of that than I ever could. I just want to write down the pain points I’ve run into, and the techniques that have worked for me.

Organizing Your Tests

Figuring out how to organize your tests can be a daunting task, especially when you’re starting a new project. Do you keep your tests beside your feature code, or do you have two distinct “src” and “test” directories? Do you break up your test files by feature? By class? By unit?

I don’t think there’s one right answer to these questions, but I know what has and hasn’t worked for me on my projects.

Test Location

I’m a fan of keeping your tests close to your source code. That doesn’t necessarily mean every foo.js has a foo.test.js beside it, but I do prefer having source code and test code in the same project, rather than keeping them in distinct source folders.

This collocation of tests and source code encourages the mindset of writing tests and source code being one and the same. I’ve worked on projects where the tests and source were in very different parts of the source repository, and the typical workflow was to write your code, and then figure out how to test it. Keeping your tests and source code in the same project doesn’t necessarily solve this problem completely, but at least it helps keep your tests readily available as you’re writing your feature or bug fix.

Breaking Up Your Tests

Breaking up your tests into distinct files (and folders if your project is large enough) is a good way to keep them manageable. I’ve worked on projects that had thousands of lines of code in the same test file, and it was a nightmare to find and update tests within those enormous files. By contrast, projects that have been broken into smaller focused test files made it much easier to find where a test should be added or updated.

How you break up your tests will partly depend on your programming language and the type of project. I’ve found that a good place to look for test grouping is the setup code for your tests. If you have the same few lines of setup code in several of your tests, consider putting them in the same test file with a shared beforeEach block. What this looks like will depend on your language and test framework.

By contrast, if you find that your beforeEach block is doing a lot of setup that’s not used by most of the tests, consider breaking the file apart into the pieces that use the different components of the setup block.

When you open a test file, it should be clear from the file name what feature(s) are being tested. This will help you navigate your test codebase when it’s time to update or add tests.

Arrange, Act, Assert

When talking about test structure, it’s common to discuss the three parts of a test: Arrange, Act, and Assert.

  • Arrange – Set up the variables, objects, and mocks you’ll use in your test
  • Act – Perform the action that you’re attempting to test
  • Assert – Verify that the action had the expected result

This organization structure for tests is probably a cliché, but it’s a useful way to think about how you organize your individual tests. Writing tests that have clear distinctions between these three sections will make it easier for other maintainers to understand what you’re trying to test.

I’ve sometimes had tests where these distinctions were hard to make, or where I felt like I needed to intermingle assertions in the other parts of the tests. This usually meant that I was testing too much, and needed to break into multiple tests.

Conclusion

Organizing your tests makes them easier to understand, navigate, and update, which makes it much easier and more enjoyable for you and your team to maintain them. Putting effort and thought into your test structure now will pay dividends in the future.

Next time I’ll talk about naming your tests and writing useful test assertion messages.

The Observer Effect and Debugging: How Dev Tools Can Change Your Code’s Behavior

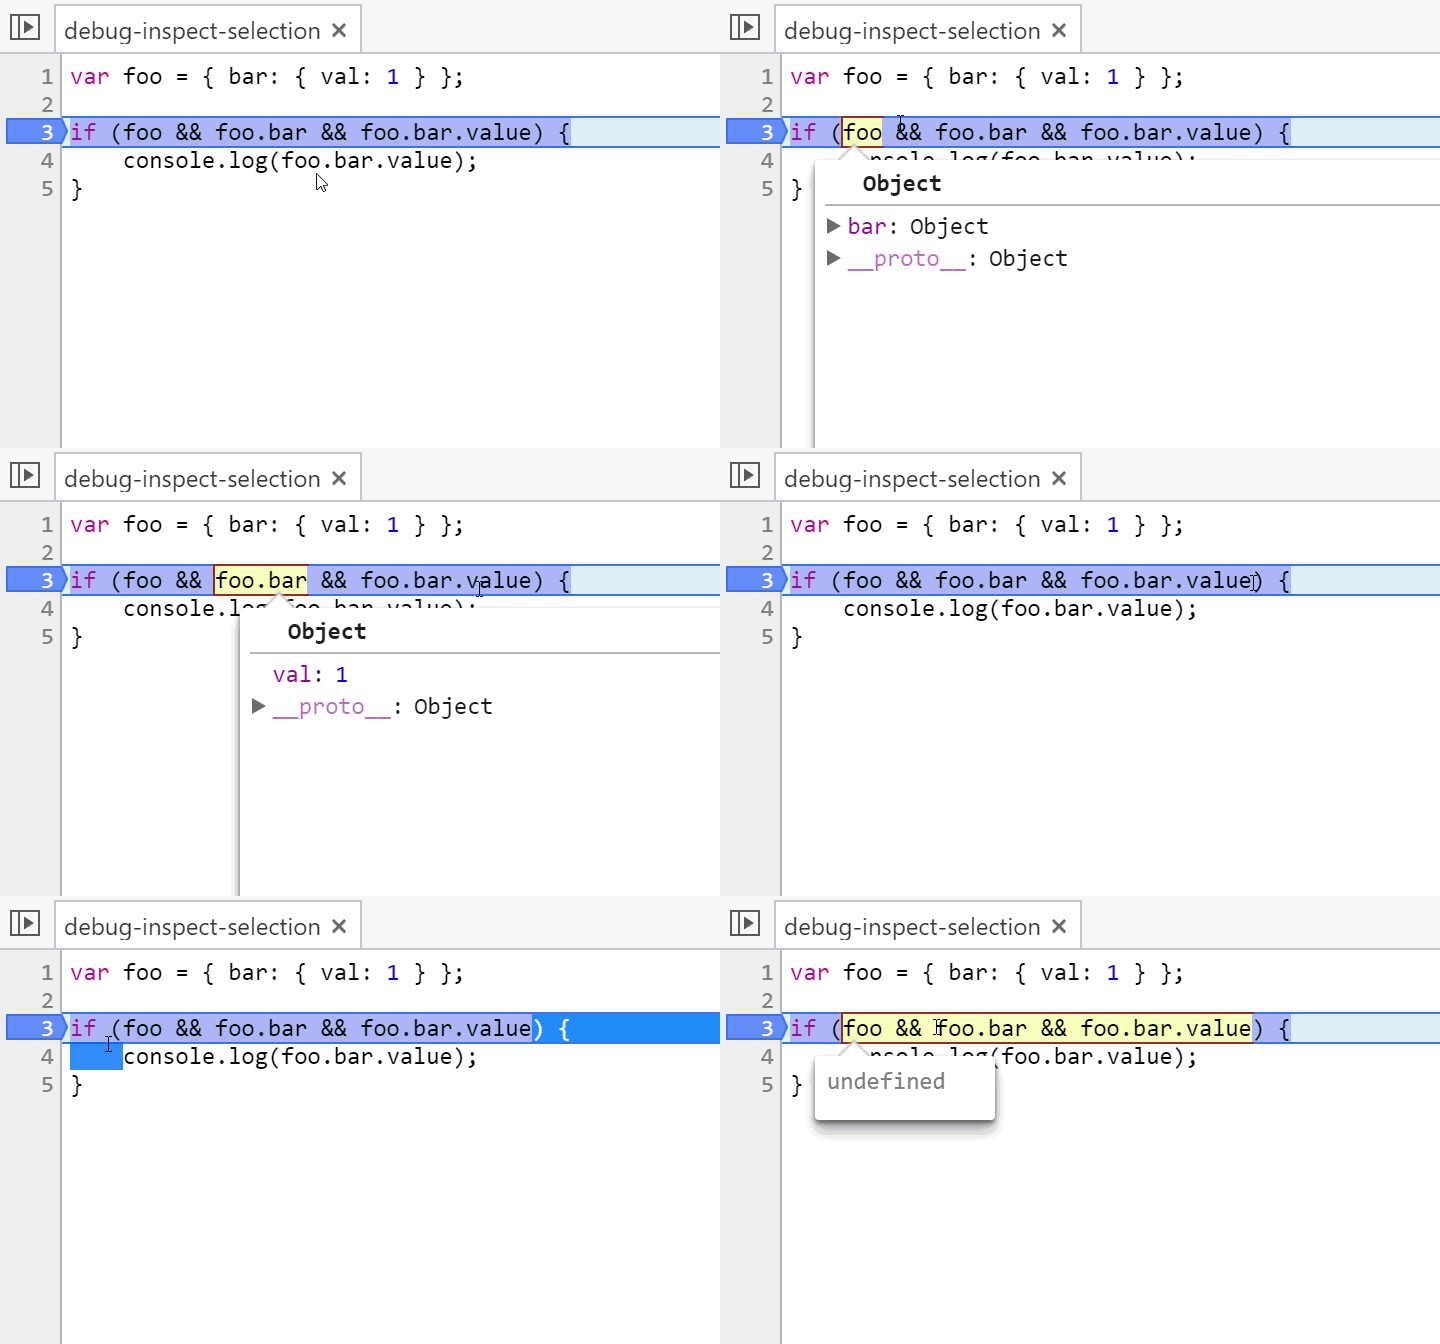
Chrome recently added a new feature to their JavaScript debugger where when you select a piece of code and hover over it, the code is evaluated and displayed in a little popover. In general, this is very useful. You can check the value of a variable, or even look at the results of more complex expressions.

Selecting Code and Hovering Shows The Result In Chrome DevTools

This is super useful, but it can also cause problems if you’re not careful about how you use it.

First, a little physics. The observer effect refers to “changes that the act of observation will make on a phenomenon being observed”. That definition precisely describes the behavior of this Chrome DevTools feature.

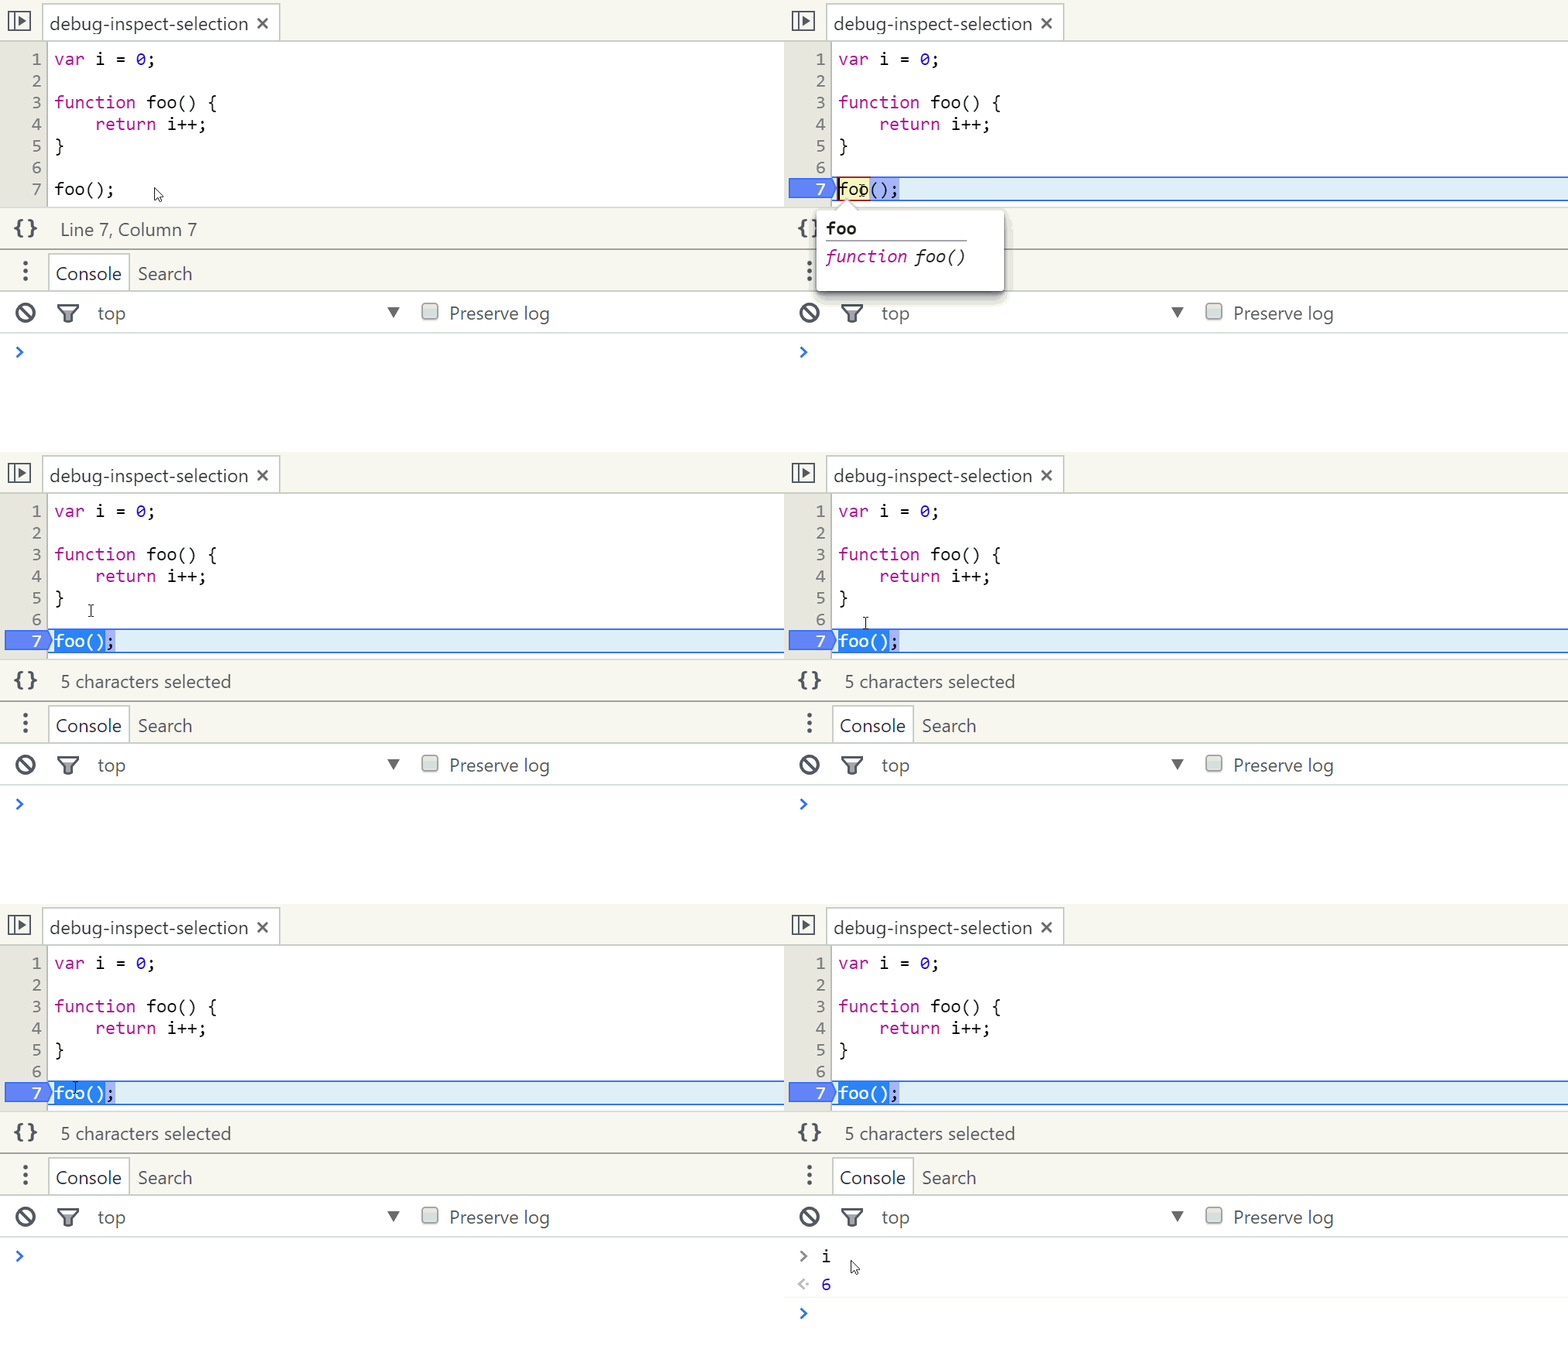
Consider the following example where I highlight a call to a function that has a side effect (incrementing the variable i). Whenever I hover over the code, it re-runs that expression, and the value of i increases.

Selecting a function call evaluates the function

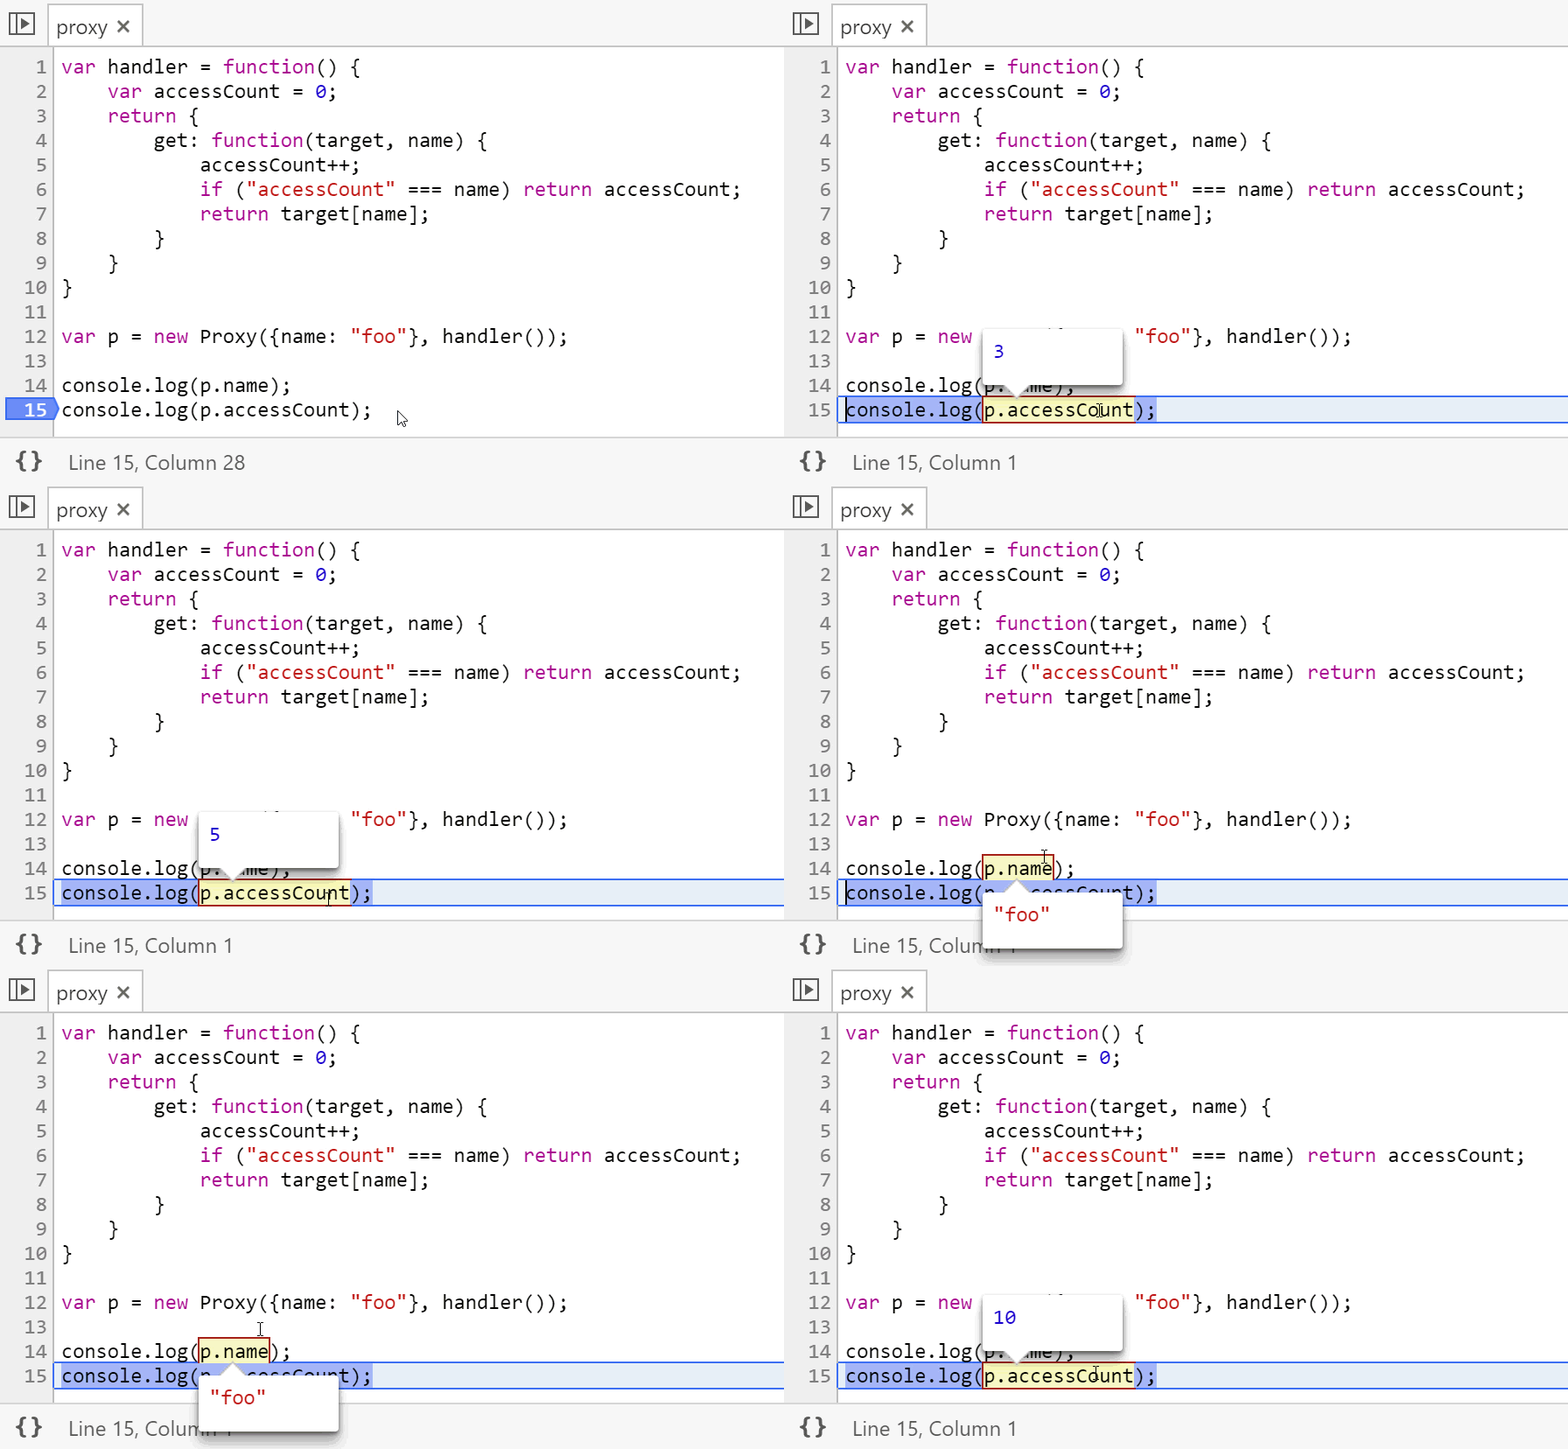
This side effect is fairly benign and easy to detect, but imagine a more complex function with multiple dependencies and obscured side-effects. Worse, you could observe the value of a Proxy object without even knowing it might have side effects.

Hovering over Proxy properties evaluates their handler

Obviously this also serves as a warning against side effects in proxy handlers, but the point here is that these previews can affect the behavior of your code in significant ways.

Several years ago, I wrote about verifying your tools after a Fiddler visualizer made a debugging session take much longer than it should have taken. The same principal holds true here. Like many other professions, understanding how your tools behave is an important part of software development.

Docker for Windows: Dealing With Windows Line Endings

One of the issues with Docker (or any Linux/macOS based system) on Windows is the difference in how line endings are handled. Windows ends lines in a carriage return and a linefeed \r\n while Linux and macOS only use a linefeed \n. This becomes a problem when you try to create a file in Windows and run it on a Linux/macOS system, because those systems treat the \r as a piece of text rather than a newline.

As a concrete example, if you try to clone the official WordPress docker image and build the image on Windows, you’ll run into problems when it tries to execute the docker-entrypoint.sh file.

The first line of that file is #!/bin/bash, which is the shebang syntax to say “run this file using /bin/bash”

However, if the file originated in windows, that first line will be interpreted as “run this file using /bin/bash\r”, and “bash\r” of course doesn’t exist, so you get this error:

1
2
$ docker run wordpress
standard_init_linux.go:175: exec user process caused "no such file or directory"

There are a couple of ways to handle this issue.

Converting Line Endings During Build

Unix has a handy CLI tool for converting line endings called dos2unix. If you want to create a robust image, you can install do2unix as a dependency, then convert any files that you copy into the image. Then as a cleanup step, you can uninstall do2unix from the image (unless the image depends on it after the build).

Your Dockerfile might look something like this:

1
2
3
4
5
6
7
8
9
FROM ubuntu:latest

RUN apt-get update && apt-get install -y dos2unix

COPY docker-entrypoint.sh /entrypoint.sh

RUN dos2unix /entrypoint.sh && apt-get --purge remove -y dos2unix && rm -rf /var/lib/apt/lists/*

ENTRYPOINT ["/entrypoint.sh"]

The main idea is to copy the script onto the machine, then use dos2unix to convert the line endings, and finally remove dos2unix from the machine (and clean up the files created by apt-get).

This is a good option if you’re managing the image, but what if you’re trying to build an image that someone else maintains?

Cloning Git Projects With Unix Line Endings

If you just want to clone and build an existing Docker image, you can use a Git flag to store the repository locally with Unix style line endings.

1
git clone git@github.com:docker-library/wordpress.git --config core.autocrlf=input

However, it’s worth noting that any new files you create will likely have Windows line endings, so you’ll still need to convert them before using them inside the Docker image.

Conclusion

That should cover the basics of line endings between Windows and Linux/macOS. These techniques apply beyond just Docker, but hopefully the Docker-specific details will help someone who’s struggling with Docker for Windows.

Docker for Windows: Interactive Sessions in MinTTY Git Bash

I recently installed Docker for Windows on my laptop. When I tried running the default docker run -it ubuntu bash demo from Git Bash, I ran into an issue I hadn’t seen before.

1
2
$ docker run -it ubuntu bash
the input device is not a TTY. If you are using mintty, try prefixing the command with 'winpty'

As it turns out, following the instructions and prefixing the command with winpty does work

1
2
$ winpty docker run -it ubuntu bash
root@88448b75631d:/#

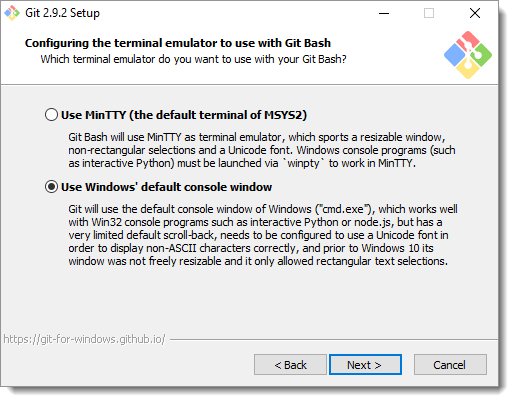
However, I’m never satisfied with just getting around an issue, so I did some more digging. Turns out the issue here is the use of MinTTY to host the Git Bash prompt. If you’ve installed Git for Windows, you’ll recall the following configuration window.

Git Bash MinTTY configuration

If you select the “Use MinTTY” option, your Bash pompt will be hosted in the MinTTY terminal emulator, rather than the CMD console that ships with Windows. The MinTTY terminal emulator isn’t compatible with Windows console programs unless you prefix your commands with winpty.

Personally, I prefer the default CMD console, especially in Windows 10 where features like window resizing and text selection are drastically improved. If you want to go back to that mode, simply re-run the Git for Windows installer and chose the non-MinTTY option. If you want to stick with MinTTY, you just need to prefix your interactive Docker (and Python, and Node, and …) commands with winpty.

Docker for Windows: Sharing Host Volumes

I’ve been playing with the new “Docker for Windows” tool recently, and I wanted to share a slightly obscure issue I ran across.

Docker lets you share volumes between your containers and your host machine. This is handy during development time, when you want to be able to quickly iterate without having to continually rebuild your container.

The Suspicious Empty Directory

When I first tried sharing a volume, I typed this into PowerShell:

1
2
3
4
5
6
7
8
9
10
11
12
13
> dir c:\docker


    Directory: C:\docker


Mode                LastWriteTime         Length Name
----                -------------         ------ ----
-a----        7/30/2016   9:47 PM              8 test.txt

> docker run -it -v c:/docker:/host ubuntu bash
root@333a10babe3a:/# ls /host
root@333a10babe3a:/#

Hmm… As you can see, the c:\docker folder has a test file, but it doesn’t show up in the Docker container. After some head scratching, I figured out the missing piece: Out of the box, Docker isn’t configured with permissions to share your drives with your containers.

Giving Docker Access

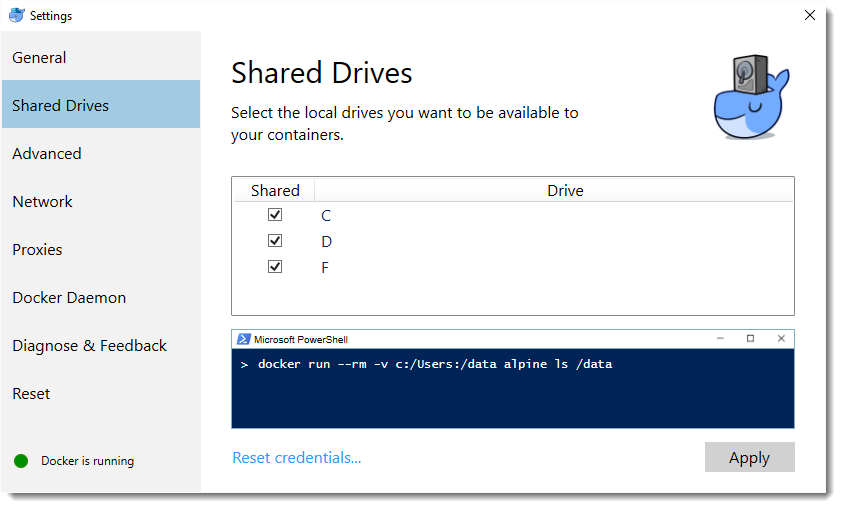
To give Docker access to your computer’s drives, right click on the Docker icon in your taskbar, then click “Settings…”

Under the “Shared Drives” section, check the drives you’d like to share, then click “Apply”

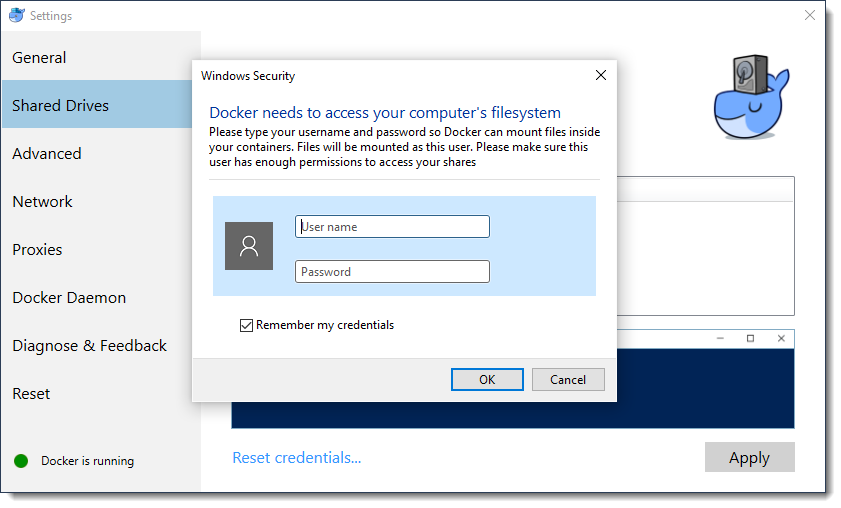
Docker will ask you for credentials, which it uses to access the drives.

(Note that if you log into your computer with a Windows Live account, your username should be something like “MicrosoftAccount\you@live.com”)

Once you save your credentials, you should be able to share volumes from your host computer to your containers.

1
2
3
4
>docker run -it -v c:/docker:/host ubuntu bash
root@00aca8c2f880:/# ls /host
test.txt
root@00aca8c2f880:/#

Software Engineering and the No True Scotsman Fallacy

“If you rely on jQuery you’re a jQuery developer, not a real developer.”

“Nobody actually enjoys writing JavaScript, they just do it because it’s the only thing that runs in the browser”

“Only academics use languages like Haskell and Lisp”

“Real developers don’t use Windows”

If you’ve been in the developer community for any time at all, you’ve probably heard statements like these. They’re popular because they’re easy to repeat and they boost the ego of the person who says them. They’re also over-generalizations.

Sure, some developers rely too heavily on jQuery. JavaScript definitely has some not-good parts that annoy many developers. Some technologies are mostly used in academia. Lots of developers prefer OS X and Linux.

But that’s not the whole picture.

Many developers know when to use jQuery for a quick solution, and when to reach for other tools. Lots of developers actually like JavaScript, and use it everywhere they can. There are large communities of people building real software with “academic” technology. While you and I are tweaking our .bash_profile, lots of real developers are using Windows and Visual Studio to get shit done.

I believe these kinds of generalizations continue to live on partly because of the “No true Scotsman” fallacy.

Person A: “No Scotsman puts sugar on his porridge.”

Person B: “But my uncle Angus likes sugar with his porridge.”

Person A: “Ah yes, but no true Scotsman puts sugar on his porridge.”

No true Scotsman – Wikipedia

The core of this fallacy is the rejection of evidence that contradicts our beliefs. It’s sort of a rhetorical form of confirmation bias.

What a convenient thing to be able to say “No real developer does X”. Any counter-examples can be easily rejected, because obviously anyone who says “wait, I do X” isn’t a real developer. No need to actually back up your claim.

Instead of rejecting technology, patterns, or methodologies because they’re not what “real developers” use, we should be willing to listen to people who have chosen that path. They chose it for a reason, and it’s worth hearing them out, even if their situation doesn’t match your own.